Before we look at what is measured in HubSpot and Google Analytics, let's know which KPIs are relevant to achieving ultimate inbound marketing success. Some of these inbound marketing KPIs provide direct, clear insight into the success of your inbound marketing efforts, while others provide indicators and trends or help identify patterns that are forming on your website and/or path to purchase. Here are 15 key KPIs to include in your ongoing inbound marketing analysis:
- Traffic sources
- Traffic on blogs, landing pages and websites
- Conversion rates
- New blog subscribers
- Leads (MQL, SQL)
- Inbound links to posts
- Social shares
- Average session duration
- Pages per visit
- Bounce rate
- Cost per conversion, per channel
- Paid ads
- Revenues from inbound marketing
In addition, these show trends and patterns:
- Exit pages - Which pages cause visitors to leave? Which have the highest number of bounces and which have the highest bounce rate?
- Blog topics - Which topics appeal to your audience? Do posts around "business strategy" get more traction or do newsjacking articles lead to traffic spikes?
Once you know how you're going to measure the success of your inbound activities, it's time to track, analyse and summarise data into optimisation opportunities and next steps. Using the combined data of HubSpot and Google Analytics provides the ultimate knowledge package and offers a real strategic advantage.
You can see most of the above KPIs directly in the HubSpot Marketing Dashboard or under the Analytic Tools if your website, landing pages and blog are hosted on HubSpot or connected to HubSpot through tracking codes. In the meantime, you can also find your own web analytics dashboard in HubSpot, which accesses data from Google Analytics. However, not all numbers are included in this. The following are not represented in HubSpot (a selection):
- Behavioural flow - from which page do visitors switch to another?
- Entries and exits on individual pages
- Various e-commerce statistics
However, these key figures are already very in-depth and rarely appear in a marketer's monthly reporting. As a rule, all important figures are available in HubSpot.
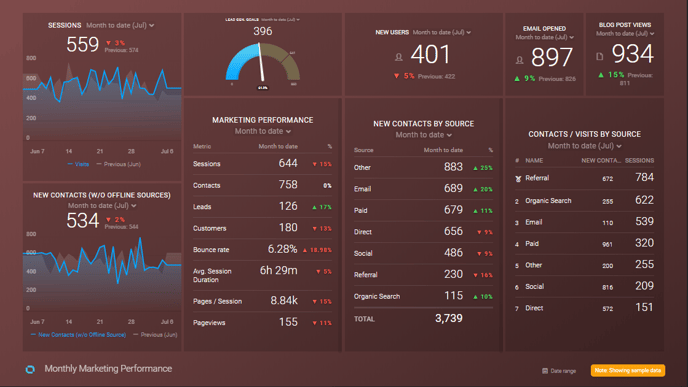
For an even better overview, we recommend using Databox. With Databox, a livestream of the most important key figures and target values is possible on a single page. Data is drawn from various sources. This way, you can display your personal KPIs from HubSpot and Google Analytics on a dashboard.
Why don't HubSpot and Google Analytics match?
It happens from time to time that the data in HubSpot deviates from that in Google Analytics. HubSpot itself has published a detailed article on this in its knowledgebase.